Assumptions
Average percent variable cost- 20%
Estimated Monthly Fixed Cost- $30,000
Estimated Monthly Fixed Cost- $30,000
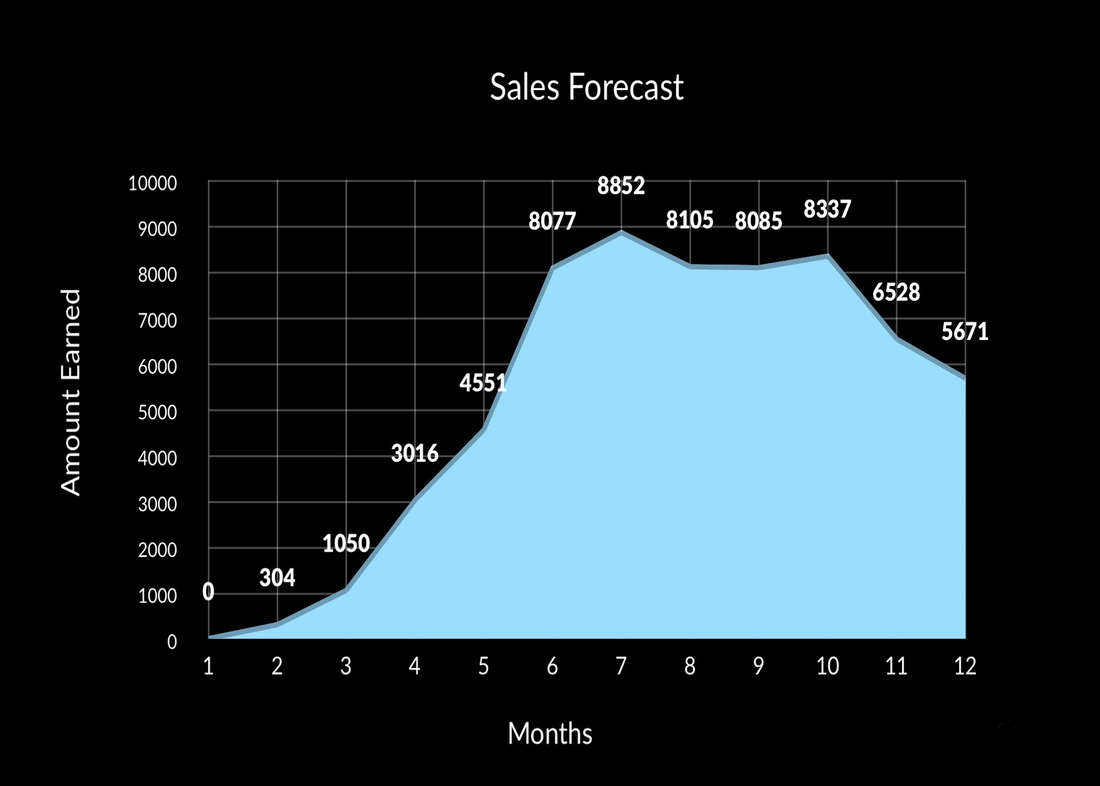
Sales Forecast
|
In the first month, we will not have any profits since this is when we are pitching our product to retailers to have a place in their stores. Over the next four months, our sales will gradually increase since we are now established in multiple retail locations. Then, in June and July, our sales will go through the roof since it is summer time and everyone is barbecuing, and will want to accommodate it with a new patio table. In 2016, 87% of Americans barbecued on the Fourth of July. (CNN) After the summertime, our sales will even out again at a steady profit. In the fall and winter, our sales we decline since the weather is cold and people do not want to worry about buying a patio table that they will not end using until the spring/summer season.
|
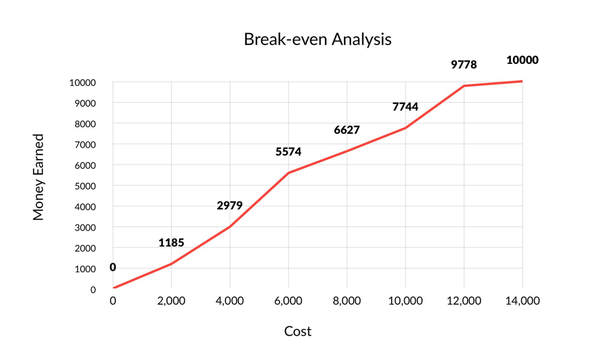
Break-even analysis
|
Our company will eventually reach the breakeven point. In a hypothesized 2-3 years. After this time period our company will begin to make a profit not exponentially, but gradually.
|
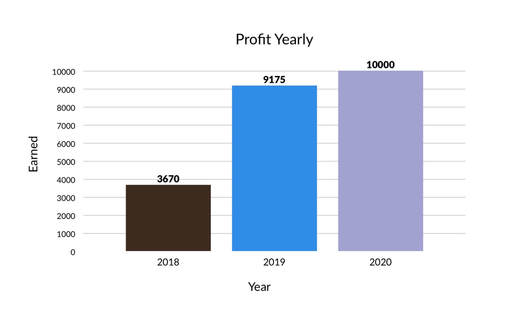
Projected profit and loss
|
We estimated around how much we will be making when we sell and how much we will lose when making each table. As you can see, the graph shows how much we have made in the year. In the first year we won't be making much since we are just barely going to be starting to sell. By the year 2020 we hope t be making around $6,000 more since more people will know about our product(s).
|
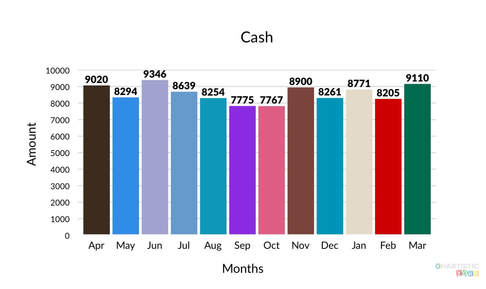
Projected cash flow
|
Projected cash flow includes the amount of money we expect to flow in and out of our business. It also includes our projected income and expenses throughout the 12 months.
|
Projected balance sheet
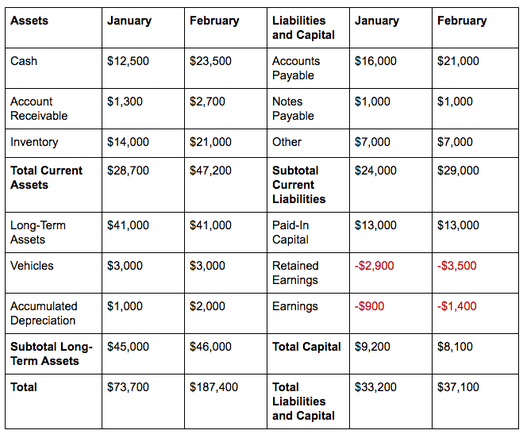
Balance sheets includes spending and income which is how much we will be spending on things like vehicles.
Business ratios
|
SALES GROWTH
1ST YR- 0.00% 2ND YR- 3.72% 3RD YR- 5.00% INDUSTRY PROFILE- 6.20% |
ACCOUNTS RECIEVABLE
1ST YR- 20.39% 2ND YR-20.75% 3RD YR- 19.27% INDUSTRY PROFILE- 21.00% |
